Creating Combination Charts in Excel
Excel is a powerful tool for visualising large, complex data sets. This Microsoft Office tool provides a wealth of options to efficiently exhibit your data, from simple graphs to complex charts. In this blog, we’ll talk about combination charts, an invaluable Excel tool that lets you display numerous data sets on a single graph.
Whether you work as a data analyst, in business, or are a student just beginning to take Excel Courses, knowing How to Make a Chart in Excel will greatly improve your ability to present data.
Table of Contents
- What are Combination Charts?
- Why Use Combination Charts?
- Visual Clarity
- Comparisons
- Space Efficiency
- Data Emphasis
- How to Create Combination Charts in Excel
- Select Your Data
- Insert a Chart
- Choose Chart Types
- Format Your Chart
- Advanced Tips for Combination Charts
- Secondary Axis
- Customising Series
- Data Labels
- Trendlines and Forecasting
- Excel Courses to Master Chart Creation
- Conclusion
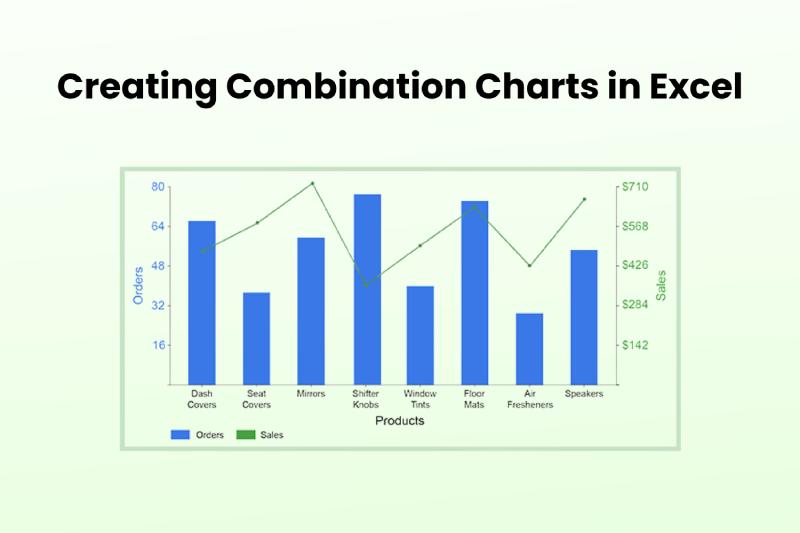
What are Combination Charts?
As the name implies, combination charts combine multiple chart kinds into a single chart area. This fusion gives you a comprehensive perspective of the data by allowing you to depict different data sets on a single graph. Line and bar charts, line and area charts, and even bar and scatter charts are examples of common pairings. Combination charts are a highly useful tool for anyone who wants to communicate various data dimensions effectively because of their adaptability.
Why Use Combination Charts?
Visual Clarity
It is feasible to illustrate a myriad number of swathes of information by means of juxtaposing different types of the charts. Let’s say, you want to show both the revenue and the number of units sold—you can plot two graphs: one is a line chart for revenue and the other is a bar chart for units sold. This chart will show both continuous and discrete variables very clearly.
Comparisons
Combination charts is another impressive method to illustrate associations and contradictions among several data groups. When you graph them on a single chart, making such trend lines, patterns and correlations easier to spot becomes possible. Hence, the whole process becomes helpful in decision making.
Space Efficiency
Combination charts help you save room and keep your presentation looking neater than individual charts for each data set. This improves your reports’ visual attractiveness and increases your audience’s ability to access them.
Data Emphasis
With combination charts at hand, you can select distinct data points and patterns in the course of your visual depiction. By using different chart types for different data sets, you may fully ensure that your audience will note the most pertinent parts of your data, which will, consequently, help you to emphasize important details.
How to Create Combination Charts in Excel
Now that we know their advantages let’s look at how to make combo charts in Excel.
Select Your Data
To begin, decide which data to use in your combo chart. To make your data easier for Excel to understand, arrange it with distinct headings.
Insert a Chart
Select your data, then select the ‘Chart’ option from the ‘Insert’ menu on the Excel ribbon. Choose the ‘Combo’ category from the dropdown menu.
Choose Chart Types
In the ‘ Combo Chart ‘ dialogue box, you can choose which chart types to display for each data series. You might select a line chart for one series and a bar chart for another. Excel gives you the option to modify the combination to suit your requirements.
Format Your Chart
Formatting the combo chart for readability and beauty is crucial after creation. Change the axis titles, labels, and colours to improve the display.
Advanced Tips for Combination Charts
Secondary Axis
You should utilise a secondary axis when merging data sets with different scales. By doing this, you can be confident that every data series is appropriately represented and that no data set will overpower any other.
Customising Series
Many choices are available in Excel to customise each series in a combination chart. Chart formats, colours, and markers can be adjusted to draw attention to particular data points.
Data Labels
Consider including data labels in your combination chart to increase its informativeness. These labels can show the precise values of data points, giving your audience more context.
Trendlines and Forecasting
By adding trendlines and forecasting to your combo chart, you can increase its analytical capacity. Using past data, this tool lets you forecast future patterns, which offers insightful information for planning and decision-making. Try out various trendline configurations to determine which one best suits your data.
Excel Courses to Master Chart Creation
Taking classes in the program can greatly improve one’s proficiency with Excel. These courses address a broad range of subjects, from fundamental characteristics to more complex ones like making combination charts. Learning Excel well will increase your output and open up opportunities for efficient data presentation and analysis.
Conclusion
To sum up, combination charts in Excel provide a dynamic means of presenting several data sets on a single graph. Making interesting and instructive charts is a valuable talent, whether you’re presenting to clients, coworkers, or classmates. You may improve the way you present data and increase the impact of your reports by learning the fundamentals of combination charts and taking advantage of their more sophisticated features.
If you want to learn more about creating charts and data visualisation, take an Excel course. Gaining proficiency in these areas will help you communicate and make more effective decisions in your career and academic endeavours.